

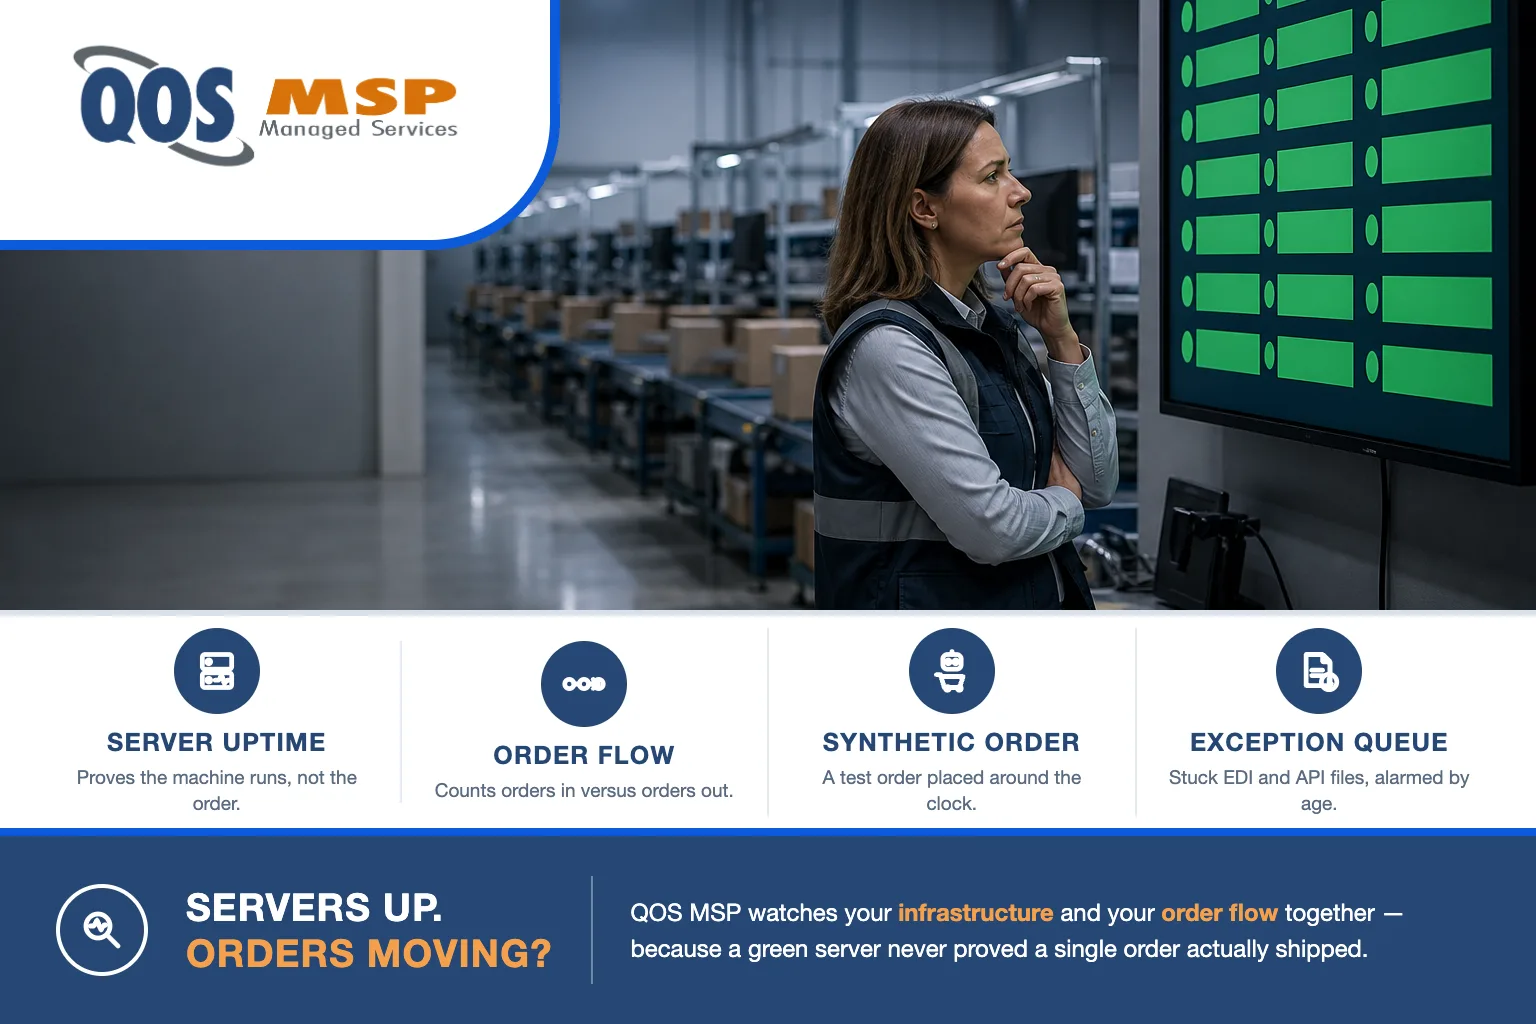
Server uptime monitoring proves your machines are running — not that orders are flowing. A stuck EDI file, a failed API call, or a full exception queue can stop shipments for hours while every dashboard stays green. Business-transaction monitoring closes that gap.
If you ship product, this is the outage that never shows up on a status page: the servers are healthy, the phones start ringing, and nobody can say why the orders stopped. Here is why it happens and what actually catches it.
How can server uptime monitoring show green while orders fail?
Infrastructure metrics answer one question: are the resources healthy? CPU, memory, disk, and “is the service responding” all measure the box, not the business. Server uptime monitoring watches whether a machine is up — it has no idea whether an order made it from the website to a printed shipping label.
But an order is a journey across a dozen systems — storefront, ERP, EDI, WMS, carrier. Resources measure the systems; the order is the thing traveling between them. A dashboard built on resource metrics is blind to a broken outcome. Every light stays green because every server genuinely is fine — the failure lives in the transaction passing from one to the next.
Where do orders silently die?
Almost always at a hand-off between systems, in one of four places. In every case the host is up and the resource dashboard is calm.
| Stage | What silently fails | Why no server alert fires |
|---|---|---|
| Order intake | The web hook, portal feed, or email-to-order channel stalls and new orders stop entering the pipeline. | A service receiving zero orders looks identical to a quiet hour. Uptime alarms trigger on down or busy — never on silence. |
| EDI / API integrations | An 850 purchase order fails validation, or a trading-partner endpoint times out, and the file sits unprocessed. | The server hosting the integration is healthy. The transaction inside it failed — and hosts do not report on their own payloads. |
| WMS processing | Orders reach the warehouse system but park in an exception status — address, allocation, or inventory hold — and never release to pick. | The WMS process is running normally. The order is held, not lost, so nothing crosses a resource threshold. |
| Shipping confirmations / ASNs | Labels print, but the 856 ASN or tracking write-back never posts back to the customer or marketplace. | The shipping service is up. The outbound message failed quietly — the first symptom is a chargeback, not an alert. |
The pattern is the same every time: the resource is fine, the outcome is broken, and no server-level alarm can tell the difference. You need something watching the order itself.
What is business-transaction (order-flow) monitoring?
It is monitoring that watches the order, not the server. You instrument each checkpoint in the pipeline and count what entered a stage against what exited it. If 500 orders hit intake in the last hour and only 480 released to the warehouse, twenty are stuck — and you know it before a single customer calls.
We deploy this alongside standard infrastructure monitoring, and the difference in a fulfillment operation is night and day. Resource metrics tell you the plumbing is intact; flow counts tell you the water is actually moving. When the two disagree — servers green, throughput down — that gap is the alert, and it points straight at the stage where orders are backing up.
What does synthetic monitoring add?
Throughput counts only catch a stall once real orders pile up behind it. Synthetic monitoring catches it when there is no order to notice. It runs a scripted test order — a test SKU on a test account — through the real path on a schedule, around the clock.
If any step fails to complete, it pages you at 2 a.m. instead of letting a customer call at 10. That matters most exactly when nobody is watching: overnight, weekends, the long quiet stretch after a deployment. A synthetic order is the difference between finding the break yourself and having a marketplace find it for you with a late-shipment penalty.
Why do integration exception queues deserve their own alarms?
Every EDI and API integration has an exception queue — the place failed and held transactions land. A healthy queue drains to near zero. A queue that is filling up is orders not shipping, in real time, and most operations never alarm on it at all.
Watch it as a first-class signal on two dimensions: depth and age. Forty items in the queue might be normal mid-batch; forty items where the oldest has sat for 45 minutes is a problem in progress. Alerting on queue depth and the age of the oldest stuck item turns a silent backlog into a page — and it is one of the cheapest instruments to add to the system administration you already run.
What should an operations-heavy business instrument first?
Order by value per unit of effort. Start at the top of this table and work down — the first two rows catch the majority of silent order failures for a fraction of the work a full platform takes.
| Layer | What to watch | Example threshold |
|---|---|---|
| 1. Synthetic test order | A scripted order run end-to-end through the real path on a schedule. | Fire every 15 min; page if it does not reach “shipped/confirmed” within 30 min. |
| 2. Integration exception queues | Depth and age of held or errored transactions. | Alert at more than 25 items, or any single item older than 30 min. |
| 3. Stage throughput | Orders entered versus orders exited, per stage, over a rolling window. | Alert if exited drops below 80% of entered across one hour. |
| 4. EDI / API acknowledgements | The 997 or API ACK expected back for each outbound message. | Alert if an 850 has no 997 within 60 min, or an ASN is un-ACKed at 2 hr. |
| 5. Infrastructure metrics | CPU, memory, disk, service up/down, connectivity — classic server uptime monitoring. | Standard host thresholds. Necessary as a floor — just never sufficient on its own. |
Note the last row. Server uptime monitoring does not leave the stack — it is the baseline you keep. The instrument-first approach just stops pretending it is the whole picture and adds the four layers above it that actually watch orders move.
Frequently asked questions
What is the difference between infrastructure monitoring and business-transaction monitoring?
Infrastructure monitoring watches resources — is the server up, is CPU and disk healthy. Business-transaction monitoring watches outcomes — did the order actually move from intake to shipped. They answer different questions, and an operations-heavy business needs both, because a perfectly healthy server can still be sitting on a stuck order.
What is synthetic monitoring in plain English?
It is a robot that places a test order on a schedule, around the clock, and follows it through every step of your fulfillment path. If any step stalls or fails, it alerts you right away — often hours before a real customer would notice and call.
Can our existing RMM or server-monitoring already do this?
Only partially. RMM and server agents see hosts and services — whether a machine is up and responding. They do not see transactions flowing between systems. Order-flow visibility needs synthetic checks plus instrumentation on your integration exception queues, which standard server uptime monitoring does not provide.
Who fixes the problem when an order-flow alert fires?
In a co-managed setup it is shared. Your MSP triages the alert, isolates whether the cause is infrastructure or application, and routes it. Infrastructure problems are the MSP to fix; application and integration fixes stay with the team that owns that software.
Do we need an expensive enterprise APM platform?
Usually not to start. Most of the value comes from a handful of targeted synthetic checks and alarms on your integration exception queues. Those capture the majority of silent order failures at a fraction of the cost, and you can add a full platform later if volume justifies it.
Who builds this — your team or your MSP?
This is where the boundary has to be exact, because order-flow monitoring straddles two teams. We have run managed IT since 2007 and monitor infrastructure for more than 75,000 users across our customers, so here is precisely what a co-managed arrangement covers.
What we own: the infrastructure layer — servers, network, connectivity, and the host-level server uptime monitoring that is part of our infrastructure management services — and the business-process observability that watches your order flow: the synthetic test orders, the exception-queue alarms, the throughput counts. We build and run that alongside your developers and application team, instrumenting the seams between your systems.
What we don’t own: your WMS, ERP, or the integration code living inside them. When a monitor fires because an order is wedged in a WMS exception, we triage it, isolate whether the cause is infrastructure or application, and route it — infrastructure problems are ours to fix; application and custom-integration fixes stay with the team that owns that software. If the fix is net-new custom development, that is QOS Software’s lane, not ours. We instrument and watch the flow; we do not rewrite your fulfillment applications.
Order-flow monitoring is observability, not recovery — a different discipline from backup and DR. If you are mapping where monitoring ends and continuity begins, we break down backup vs disaster recovery vs business continuity separately.
When plain infrastructure monitoring is genuinely enough: if your business is not operations-heavy — no EDI, no warehouse, orders a human eyeballs the same day — then server uptime monitoring on its own is the right amount of monitoring. Do not buy transaction instrumentation you will never look at. The failure modes in this article only bite when orders move through automated systems faster than any person could watch them.
If that is you — if a stalled queue means a truck leaves empty and a marketplace docks your score — the gap between “servers up” and “orders shipping” is worth closing before the next silent morning. Talk to us and we will map where your order flow can fail blind, including the checks you can stand up yourself.
Related: the operational logging that powers order-flow monitoring is also what lets you answer a security questionnaire with evidence instead of guesses.
